







Youth sports fan engagement lives and dies by patterns you can only see if you're tracking them. Which age groups draw the biggest sidelines? Which game times keep families around after their kid's finished playing? The answers are already in your attendance data, and once you start reading them, building a stronger community gets a lot less complicated.
Executive Summary:
- Attendance data reveals which game times, age groups, and event formats keep families coming back, so you can schedule with real evidence.
- First-time attendees who return within the same season are your strongest signal of community health and loyalty.
- Mobile check-in and digital ticketing generate per-session data that shows where crowd energy peaks and where families drop off.
- Seasonal attendance patterns double as an off-season roadmap, pointing to unmet needs you can meet with clinics and targeted outreach.
- Fastbreak AI connects registration data, scheduling, and attendance tracking so patterns surface without manual spreadsheet work.
What Fan Engagement Means in a Youth Sports Context
Fan engagement in youth sports looks different from what you'd see at a professional game. There's no broadcast deal, no merchandise empire, and no national fanbase. The "fans" are mostly parents, siblings, and community members who show up because someone they love is on the field.That context matters when you start talking about attendance analytics. The goal isn't filling seats for revenue. It's understanding who shows up, when they come back, and what keeps them connected to your program over time.
Strong communities aren't built by accident.
They're built when organizers pay attention to patterns and act on what they see, starting with making a great first impression at check-in.
Why Attendance Data Is the Starting Point for Engagement Strategy
Attendance patterns tell you more than just how many people showed up. They reveal which age groups draw the biggest crowds, which game times keep families in the stands, and which events bring people back season after season.
When youth sports organizations collect and act on this data, they stop guessing about what fans want. Instead, they make scheduling, programming, and communication decisions grounded in what actually moves the needle on youth sports fan engagement. Deloitte's analysis of fan engagement analytics shows how integrated data sources can surface hidden audience segments and drive better event attendance decisions.
What to Track First
Not all attendance data carries equal weight, though. Start with the metrics that connect most directly to fan behavior:
- Game time and day of week attendance rates, since families with packed schedules respond differently to Saturday morning slots versus weeknight games
- Year-over-year attendance trends by age division, which show where your community is growing and where interest is softening, insights that pair well with mastering online event ticketing to close the loop between sales and turnout
- Single-visit versus multi-game attendance, which separates casual observers from the fans most likely to become long-term community members
- Weather and venue correlation data, because external factors skew numbers and need to be isolated before drawing conclusions
These metrics form the foundation. Once you can see patterns clearly, you can build an engagement strategy with a real target instead of a rough estimate.
What Attendance Analytics Actually Captures
Attendance data goes well beyond counting heads at the gate. When tracked consistently, it builds a detailed picture of who your community actually is, how they behave across a season, and where your engagement is growing or falling off.
The metrics that matter most tend to fall into a few clear categories:
- Turnout patterns by game type, day, time, and opponent, which reveal which matchups or scheduling decisions drive the most community participation.
- Repeat attendance rates that show whether families are making youth sports a regular habit or only showing up occasionally.
- New vs. returning attendee splits that help you understand whether your community is growing or simply retaining the same core group season after season.
- No-show and dropout trends that signal when registration enthusiasm isn't converting into actual sideline presence, a gap that offline ticketing for smooth tournaments can help close at the gate.
Tracking these data points over multiple seasons lets organizations move away from gut-feel decisions about scheduling, programming, and outreach. Instead, you get a factual baseline to measure against, which makes it far easier to spot what's working and act on what isn't.
Building Game-Day Experiences That Keep Families Coming Back
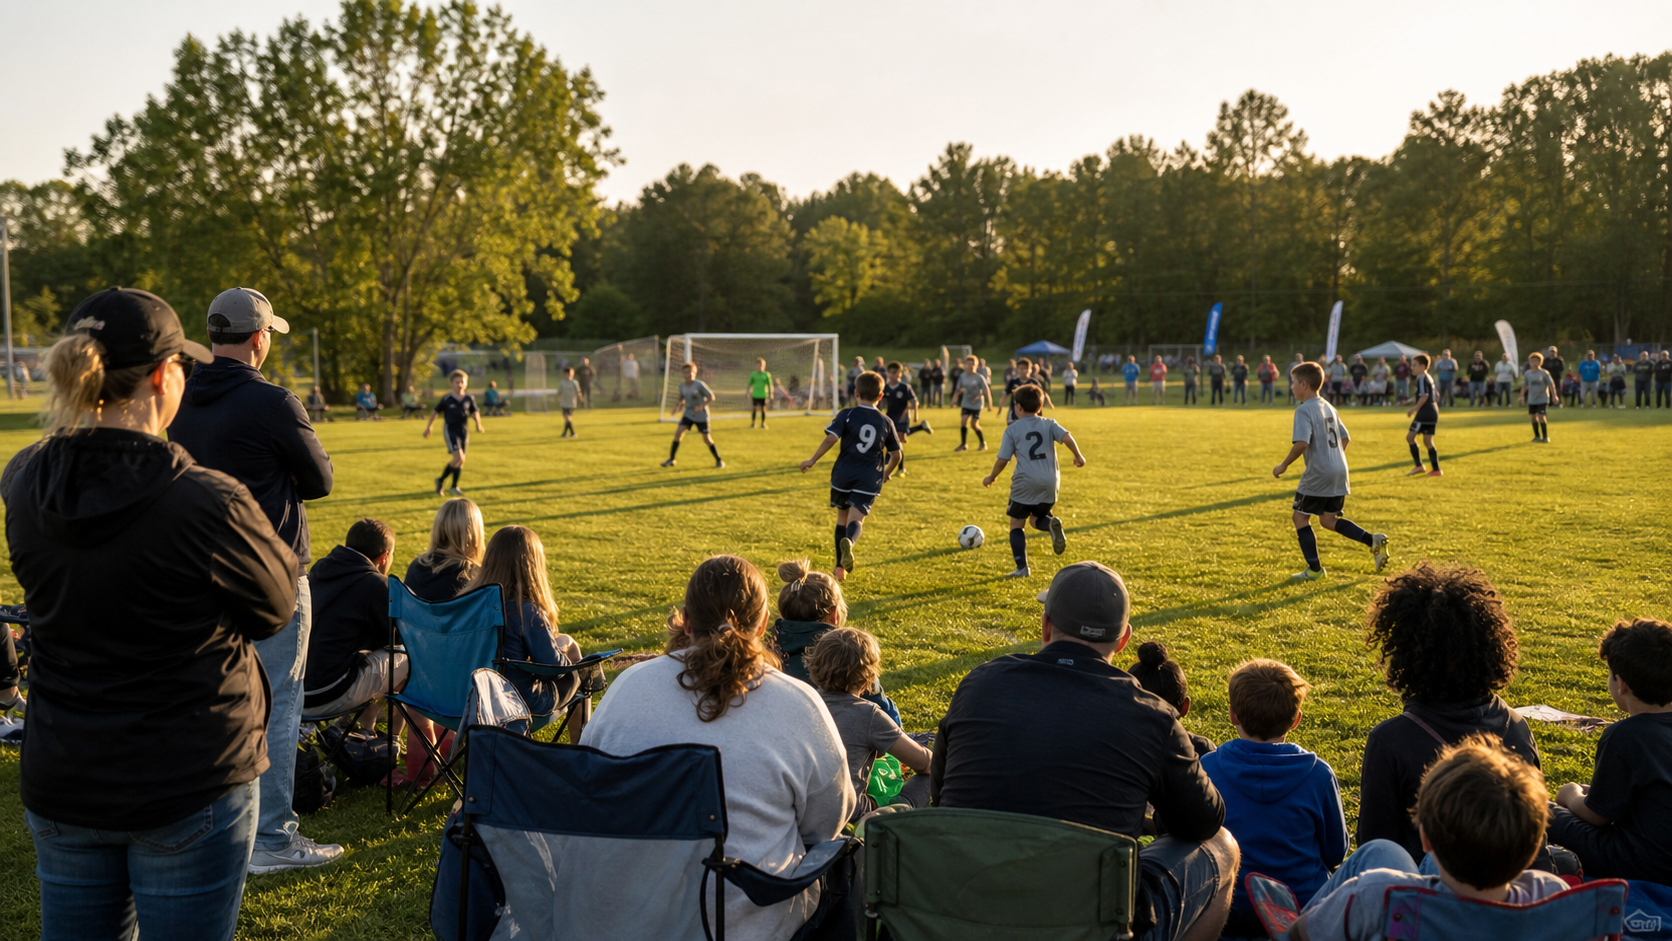
Attendance data tells you who shows up. The real question is what you do with that information to make the next event worth coming back to.
When you track patterns across multiple events, you start to see what actually moves the needle on youth sports fan engagement. Families who arrive early and stay late are signaling something. So are the ones who come once and never return. Both groups are giving you data you can act on, and capturing it accurately starts at the gate with mobile ticketing at the gate.
Timing and Programming
Gate arrival times reveal when energy peaks and drops throughout your event day. If most families arrive 30 minutes before the first game but leave right after their child plays, your between-game programming probably has a gap.
- Scheduling high-demand matchups or special activities during historically low-attendance windows can redistribute crowd energy and extend average stay times.
- Concessions and vendor placement decisions become sharper when you know where foot traffic concentrates by hour, and choosing among the best offline ticket scanning platforms keeps gate data flowing even without a connection.
- Volunteer and staff scheduling aligns better with actual crowd flow instead of guesswork.
Repeat Attendance as a Loyalty Signal
First-time attendees who return for a second event within the same season are your strongest indicator of community health. Tracking that cohort separately from general attendance lets you see which programming decisions are building genuine loyalty versus just drawing one-time curiosity.
If a particular event format or age bracket consistently pulls higher return rates, that is worth expanding.
Gate Technology That Generates Engagement Data

Free mobile ticketing services do more than speed up gate entry. Every scan generates a data point: who showed up, when they arrived, which session drew the biggest crowd, and where attendance dropped off across a multi-day event.
That data is where real fan engagement work begins. At the World Taekwondo Grand Prix, Fastbreak Tickets simplified entry for international attendees across a multi-day championship event, and every scan built a record of crowd flow that organizers could act on, as documented in the World Taekwondo Grand Prix success story. The same principle applies at the youth sports level: gate data collected through mobile ticketing becomes the raw material for smarter scheduling, better programming, and stronger community engagement over time.
Turning Gate Data Into Actionable Insights
When you track attendance patterns over time, you start to see what actually pulls families back and what causes them to leave early or skip sessions altogether.
- Peak arrival windows tell you when to schedule your highest-energy programming, so the most engaged fans see the best experience.
- Per-session attendance drops can reveal scheduling conflicts, venue comfort issues, or matchup timing problems that no survey would catch.
- Return attendance rates across consecutive events show whether your community-building efforts are working or whether families are treating each event as a one-off.
Youth sports organizations that connect gate data to their broader engagement strategy stop guessing and start making decisions grounded in real behavior.
Social Media and Digital Channels That Extend the Stands
Youth sports communities increasingly live online between games, and that's where fan engagement gets built or lost. Social media, game recap clips, and digital leaderboards extend the energy of game day into the rest of the week, giving families a reason to stay connected long after the final whistle. PwC research on younger sports fans found that younger audiences are 1.4 times more likely than older fans to attend a live event at least once a month and overwhelmingly use social media during games, something worth keeping in mind as you build your digital strategy. The sponsorship asset hiding on every ticket you sell adds another layer of community value.
Attendance analytics help you understand which digital touchpoints are actually working. When you track which posts generate the most shares, which game recaps drive return visits to your site, or which email updates see the highest open rates among parents, you stop guessing and start acting on real patterns.
Channels Worth Your Attention
Not every channel earns its time investment equally. Focus your effort where your community is already active:
- Short-form video recaps posted within 24 hours of game day tend to generate strong engagement from families who couldn't attend in person, keeping them connected to the season's momentum.
- Email digests with attendance milestones or season standings give parents a quick, shareable update that reinforces the community's growth over time.
- Tournament mobile apps let coaches and families interact in a lower-noise space, which often drives higher ongoing participation than public social channels.
Tracking engagement across these channels alongside your attendance numbers gives you a fuller picture of community health, covering who showed up and who stayed invested.
Year-Round Community Engagement Beyond the Season
Attendance data collected during the season doesn't have to stay locked inside a spreadsheet once the final whistle blows. The patterns you gather across registration cycles, game-day turnout, and family participation give you a roadmap for keeping your community connected all year long.
Turning Seasonal Data into Off-Season Programming
Look at which age groups drew the most consistent attendance and which events saw the sharpest drop-offs. Those gaps often point to unmet needs: families who want structured activity but have nowhere to go between seasons. Use that information to schedule off-season clinics, open gyms, or skills workshops timed to when your data shows families are most likely to show up, supported by Fastbreak's tournament mobile app that keeps families informed year-round.
Communicating With Families Between Seasons
Engagement drops when communication does. If your registration data tells you a family has a child in the 10-12 age bracket, off-season outreach about age-appropriate programming feels relevant instead of generic. Segmented messaging keeps your community warm and gives families a reason to stay connected to your organization even when no games are on the schedule.
- Reach out to high-attendance families first, since they are your most engaged segment and most likely to register for off-season events.
- Flag families who attended inconsistently and send them targeted content that speaks to barriers like cost or scheduling conflicts.
- Use registration anniversaries or seasonal milestones as natural moments to re-engage lapsed participants with a timely, personal message.
Measuring Youth Sports Fan Engagement Success
Tracking whether your fan engagement efforts are actually working starts with knowing which numbers matter. Attendance figures alone tell an incomplete story, so successful youth sports organizations pair them with a broader set of indicators.
Metrics Worth Watching
Consider building your measurement framework around these areas:
- Attendance trends over multiple seasons, broken out by age group and event type, reveal whether your community is growing or stagnating before the problem becomes obvious.
- Volunteer participation rates signal how invested families feel beyond just showing up, since engaged communities tend to give more of their time, a pattern covered in depth in this youth sports tournament impact measurement guide.
- Social media reach and local press mentions tied to specific events help connect your outreach efforts to real-world turnout.
- Post-event survey scores from parents and athletes point directly to which experiences earn repeat attendance and which ones quietly push families away.
Turning Data Into Action
Collecting metrics is only half the work. The real value comes from reviewing them consistently and sharing findings with coaches, board members, and other stakeholders who can act on what the numbers show. A quarterly check-in rhythm, even an informal one, keeps fan engagement from becoming an afterthought between seasons. When attendance dips or survey scores slip, having a baseline makes it far easier to identify what changed and respond accordingly.
How Fastbreak AI Connects Attendance Analytics to Community Strength

Attendance data tells a story that goes well beyond filled seats. When youth sports organizations track who shows up, how often, and under what conditions, they gain a clearer picture of what their community actually values. Fastbreak AI brings that data together in one place, making it easier to act on what you see.
Turning Attendance Patterns into Smarter Decisions
The most actionable insights come from tracking attendance over time across different game types, age groups, and venues. When you can see that weeknight games draw 30% fewer families than weekend morning games, you can restructure your schedule accordingly. When you notice that playoff attendance spikes while regular season numbers plateau, you know where to invest in experience improvements.
Fastbreak AI connects registration data, scheduling, and attendance tracking so those patterns are visible without manual spreadsheet work. You can spot trends early and respond before families disengage.
From Data to Community Connection
Attendance analytics also show which segments of your community are underserved. Low turnout from certain zip codes or age brackets often signals access barriers, not lack of interest. Organizations that act on those signals by adjusting game times, reducing travel distances, or offering tiered pricing build deeper roots in their communities.
That kind of responsiveness is what turns casual families into loyal ones.
Final Thoughts on Growing Fan Engagement in Youth Sports Programs
Strong youth sports communities are built on patterns, not hunches. When you know which games draw families back, which schedules cause drop-offs, and which age groups are quietly losing momentum, you can make decisions that actually move things forward. The data is there every season. Using it consistently is what turns good intentions into a community people want to be part of. Connect with the Fastbreak AI team to learn how attendance analytics fits into your program.
FAQ
What attendance metrics should youth sports organizations track first to improve fan engagement?
Start with four data points: game time and day-of-week attendance rates, year-over-year trends by age division, single-visit versus multi-game attendance, and weather or venue correlation data. These give you a factual baseline to measure against, so programming and scheduling decisions are grounded in real behavior, not guesswork.
How do I use gate data from digital ticketing to build a stronger youth sports community?
Every scan from mobile check-in generates actionable data: peak arrival windows, per-session attendance drops, and return rates across consecutive events. Review those patterns consistently and share findings with coaches and board members on a quarterly basis, so fan engagement stays on the agenda between seasons and never becomes an afterthought.
Fastbreak AI vs. spreadsheets for tracking youth sports fan engagement data across multiple seasons?
Spreadsheets break down quickly when you need to cross-reference registration data, attendance trends, and scheduling decisions across multiple seasons and age divisions. Fastbreak AI connects registration, scheduling, and attendance tracking in one place, so patterns are visible without manual data reconciliation, and you can spot disengagement early enough to act on it.
Can low attendance in certain zip codes or age brackets signal a fan engagement problem worth solving?
Yes, and it often signals an access barrier, not a lack of interest. Low turnout from specific geographic areas or age groups can point to scheduling conflicts, travel distance, or cost friction. Organizations that adjust game times, reduce travel demands, or offer tiered pricing based on this data tend to convert casual attendees into loyal community members over time.
What is the difference between tracking general attendance and tracking repeat attendance in youth sports?
General attendance tells you how many people showed up. Repeat attendance tells you whether your community-building efforts are working. Families who return for a second event within the same season are your strongest indicator of program health, and tracking that cohort separately reveals which event formats or age brackets are building genuine loyalty versus drawing one-time interest.


