
You're sitting in a city council meeting trying to convince them why they should contribute funds to your event again next year. They want proof your tournament generates real economic activity. You mention hotel rooms filled and restaurants packed, but when they ask how you measured it, you describe surveys that families filled out three days after checkout. That's the moment you lose credibility. Measuring the economic impact of sports events requires tracking verified visitor spending, not estimates collected after the fact. The cities funding your venue access expect methodology that holds up under audit. This guide walks you through the exact metrics Convention and Visitor Bureaus (CVBs) demand, the multipliers they'll accept, and how to separate direct spending from the inflated numbers that get reports rejected.
Executive summary:
- Direct spending (hotels, meals, tickets) must be separated from indirect impact (multiplier effects) to maintain credibility with city officials.
- Track four metrics: total nonlocal attendance, visitor origin, average daily spending per person, and length of stay.
- Conservative regional multipliers (1.8x-2.5x) protect credibility better than inflated national averages that trigger audits.
- Geolocation data paired with first-party surveys eliminates memory-based estimates and verifies actual visitor behavior.
- Fastbreak Pulse combines geolocation tracking with survey data to deliver verified impact reports cities trust.
Understanding Direct vs Indirect Economic Impact
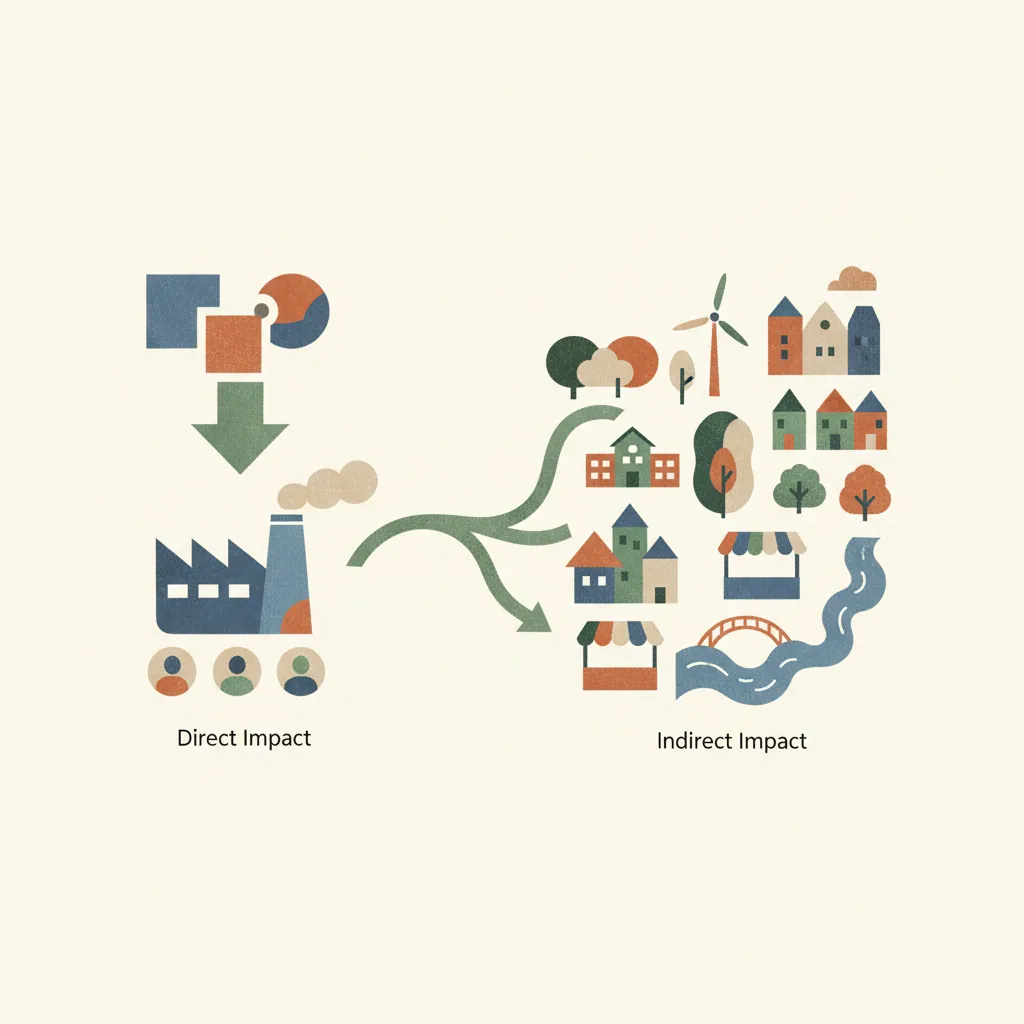
Before we dig into the hows of measuring economic pact, you need to understand the distinction between direct versus indirect economic impact. Understanding this will help better frame the KPIs that we will talk about later.
When a visiting family spends $150 at a hotel or $40 at a restaurant during your event, that's direct economic impact. Direct spending includes every dollar visitors pay for hotels, meals, gas, tickets, and retail during the event window. You can track it with receipts, surveys, and credit card data. But the establishments and businesses frequented by your tournament participants use that money to pay their staff and order from local suppliers. When that staff spends their wages at other businesses and those suppliers buy from local retailers, that's indirect spending. It's a chain reaction that measures how the original dollar, spent by the tournament participants, moves through the local economy over time.
If you tell a city council your event generated $2 million in economic impact without clarifying that $500,000 was direct and $1.5 million was indirect, you risk credibility. Multipliers vary wildly by region. A beach town might see a 2.5x effect of direct to indirect. A rural area might only hit 1.8x.
A Note About Economic Multipliers and What They Actually Mean
A multiplier converts direct visitor spending into total economic impact.
The National Association of Sports Commissions reports an average multiplier of 2.37 across the United States. But copying a national average into your local report is a mistake. Rural economies with limited service infrastructure often see multipliers below 2.0. Dense urban areas with diverse supply chains can push past 2.5.
As a general rule of thumb, when using an economic multiplier to show indirect economic impact, you should use conservative multipliers to protect your credibility. Use published regional multipliers from your CVB or state tourism office. If those don't exist, default to 2.0 or lower and document your rationale.
Key Metrics Every Event Organizer Should Track
Okay, now that we have that distinction out of the way, let's look at the four core data points that every event organizer should track and use to show the proven impact of their event on the local economy:
- Attendance: Count unique visitors, not simply gate entries. If the same family returns on Saturday and Sunday, that's still one household spending unit.
- Visitor origin: This is the percentage of attendees who traveled from outside your local metro area matters because local residents spending money in their own city doesn't create new economic activity.
- Average spending per person per day: You can break this into categories: lodging, food and beverage, retail, entertainment, and fuel. Survey data works if you ask the right questions while families are still on-site.
- Length of stay: A two-night event generates double the hotel revenue of a one-night event, even with identical attendance.
Calculating Visitor Spending Patterns
You can't count money that was already circulating in your local economy. A family from five miles away spending $50 downtown during your event isn't new economic activity. Only nonlocal visitor spending creates new impact.
The key to this data point is to break attendees into three buckets: overnight visitors, day trippers, and local residents.
Overnight visitors generate the highest per-capita spending because they need hotels, multiple meals, and entertainment outside of game time. To capture this data from first-party sources, you can survey families at the venue. Ask where they're traveling from, how many nights they're staying, and estimated total spending on lodging, food, retail, and fuel. Then, to calculate the direct visitor spend, multiply the number of nonlocal parties by their average daily spend, then by length of stay. If 400 families traveled from out of town, stayed two nights, and spent $200 per day, your direct visitor spending is $160,000.
Common Measurement Mistakes That Inflate Results
The fastest way to lose credibility with CVBs, and jeopardize potential event funding, is to submit an impact report that overstates reality. Three mistakes appear in nearly every inflated study:
- Counting local residents as economic generators is the most common error. If 60% of your attendance lives within the county, their spending doesn't create new economic activity. It's money that would have circulated locally anyway.
- Applying a 3.0x or 4.0x multiplier without regional justification is another red flag. CVB analysts will ask where that number came from. If you can't cite a published regional study, your entire report loses credibility.
- Ignoring substitution effects is the third mistake. If your volleyball tournament fills hotels the same weekend as the county fair, you're competing for the same rooms.
Methodologies for Sports Event Assessment
Two methodologies dominate economic impact assessment for sports events. National Income Accounting provides the most conservative approach by calculating only direct visitor spending without applying multiplier effects. You add hotel bills, restaurant receipts, fuel purchases, and retail transactions, then stop. This method satisfies skeptical city councils because it reports only verified cash flow.
But there may be times when that number doesn't paint the real picture. That's when you can lean into using multipliers to add an additional layer of value to the economic impact of your event. When using them, you are changing the methodology from National Income Accounting to Keynesian.
The Keynesian model builds on that foundation by applying regional multipliers to estimate indirect and induced effects. This is the approach most CVBs expect because it captures the full economic ripple. The OECD recognized this framework as the global standard for sports event measurement.
Which methodology should you use? Match your methodology to your stakeholder. Grant applications demanding hard numbers favor NIA. Tourism boards seeking full impact prefer Keynesian calculations with documented multipliers.
Using First-Party and Geolocation Data to Verify Economic Claims
First-party data comes from your participants through event apps, registration forms, and on-site surveys. You ask families where they traveled from, how many nights they booked, and daily spending. When you control the source, you control the accuracy. But, you are relying on people to answer honestly and, more importantly, remember exactly what they spent and when. Surveys ask families to estimate spending after multiple games and meals. Memory fails. Numbers get rounded.
Geolocation data removes the guesswork by validating what surveys claim. Cell phone location tracking shows where visitors came from, which hotels they booked, how many nights they stayed, and which businesses they visited during the event window. You see a parent entered a specific restaurant at 6:47 PM on Saturday, not their estimate of $80 or $120. If a family reports staying two nights but their device data shows they left town after one, your data needs correction. Survey 30% of attendees through your mobile app while they're at the venue.
This comes from opt-in mobile apps or aggregated anonymized location signals. You identify out-of-town visitors by home zip code, then track their movement across your city. If 300 unique devices from outside your metro area pinged locations near your venue across three days, you have verified visitor behavior.
Pair geolocation with first-party surveys inside your event app to cross-check spending totals. Location data shows where they went. Surveys show how much they spent. This dual-layer approach catches inflation before you submit reports to city stakeholders who will audit your methodology.
Building Credible Reports for Stakeholders
When putting together your report for stakeholders, there are some common best practices to build credibility not simply for your event but for the methodology by which you gathered and reported on that data. Here are few things to keep in mind as when you are preparing your report:
- City officials will almost always reject promotional language. They want methodology disclosed upfront, conservative multipliers, and separate direct spending from indirect effects. Show how you collected data, which multipliers you applied, and why.
- Include a limitations section. Acknowledge what you couldn't measure and where estimates replaced hard data. This builds trust with CVBs deciding whether to fund next year's event.
- Lead with total verified visitor spending, then show the multiplier calculation. Break spending into lodging, food, retail, and fuel categories so stakeholders see where money flowed.
Fastbreak Pulse: From Guesswork to Verified Impact Intelligence

We built Fastbreak Pulse to solve the credibility gap between what cities need and what most impact reports deliver. Instead of asking you to estimate where 800 families spent money across a weekend, Pulse pulls verified geolocation data and first-party survey responses directly from the Fastbreak app.
You see origin zip codes, confirmed hotel check-ins, restaurant visits, and retail stops. CVBs get the documented proof they need to make informed decisions about grants and facility investments. No inflated multipliers. No memory-based spending guesses.
When you submit a Pulse report to city council, you're showing the same data infrastructure trusted by the NBA and NHL, adapted for amateur sports. That's how you turn a one-time event into multi-year funding.
Final Thoughts on Economic Impact Assessment for Sports Events
The difference between getting funded next year and losing your venue contract comes down to credibility in your impact report. Measuring economic impact with geolocation-verified visitor data and conservative regional multipliers gives city councils the proof they need to convince facility investments and grant approvals. Skip the inflated estimates, show your methodology upfront, and separate what visitors actually spent from what rippled through the local economy. Get in touch if you want to build reports that turn single events into long-term funding relationships.
FAQ
How do I separate direct spending from indirect spending in my impact report?
Direct spending is what visitors pay during the event window: hotel bills, restaurant receipts, fuel, and tickets. Indirect spending is the ripple effect as those dollars move through wages, suppliers, and local businesses. Always report them separately in stakeholder documents to maintain credibility with city officials.
What multiplier should I use if my CVB doesn't publish regional data?
Default to 2.0 or lower and document why you chose that number. The national average sits at 2.37, but rural areas often fall below 2.0 while dense urban markets can exceed 2.5. Conservative multipliers protect your credibility when grant committees audit your methodology.
Can I count local residents in my economic impact calculation?
No. Families from within your metro area don't create new economic activity because their money is already circulating locally. Only spending from nonlocal overnight visitors and day trippers from outside your region generates real impact.
How do I verify visitor spending without relying on memory-based surveys?
Pair geolocation data with first-party surveys inside your event app. Location tracking shows where families stayed, which restaurants they visited, and how many nights they booked. Surveys capture dollar amounts while geolocation confirms behavior patterns, eliminating the guesswork that undermines most impact reports.
When should I use National Income Accounting versus the Keynesian model?
Use National Income Accounting when stakeholders demand hard numbers with zero estimation: it counts only verified direct spending. Use the Keynesian model when CVBs or tourism boards expect full economic ripple effects with documented multipliers. Match your methodology to who's reading the report.
