
Your city stakeholders approved budget to the CVB for last year's tournament based on projected economic impact. In short, they want to attract more money from sports tourism. This year they want to see what actually happened. But, the consultancy that's been retained to gather this data is reporting that hotel partners are slow to report room nights, attendance numbers are estimates, and spending data is based on generic multipliers from a study done in another state. Sports tourism ROI measurement solutions CVB impact tracking software solves this credibility gap by collecting verified visitor data through actual event operations. You get real numbers tied to real attendees, not modeled assumptions that fall apart under scrutiny.
Exec summary:
- Cities waste thousands on consultant-led impact studies that take weeks to deliver backward-looking estimates
- First-party attendee data beats generic mobile signals for proving actual visitor spending to city councils
- Real-time dashboards let you show economic impact while events run, not months after they end
- Fastbreak Pulse automates verified impact reporting through direct integration with event operations
- Fastbreak Pulse tracks visitor origin, hotel bookings, and spending patterns across your entire event calendar
What Are Sports Tourism ROI Measurement Solutions?
Sports tourism ROI measurement tools track the economic impact of sporting events on host cities. These systems help CVBs, sports commissions, and destination marketing organizations quantify visitor spending, hotel room nights, and tax revenue generated by tournaments and competitions. The stakes are substantial: youth and amateur sports tourism alone generated $52.2 billion in travel-related spending in 2023, outpacing spectator sports tourism's $47.1 billion.
The challenge is simple: city councils and stakeholders want proof before they commit grant funding or approve event bids. Generic estimates don't cut it anymore. You need verified numbers showing who came to town, where they stayed, and what they spent. But, traditional economic impact studies rely on expensive consultant-led analyses that take weeks to produce and often use broad multipliers to extrapolate spending. The data is always backward-looking and impossible to verify in real time.
The new generation of sports commission analytics uses geolocation data, first-party surveys, and verified attendee tracking. These tools collect actual visitor behavior during the event, not estimates weeks later. The result is faster reporting, more accurate numbers, and credibility with the people writing checks.
How We Assessed Sports Tourism ROI Measurement Solutions
We assessed each solution against five core criteria that matter most when making the case of public funding for sports events:
- First, data accuracy. We favored tools using first-party attendee data over generic mobile location signals or multiplier-based estimates. Verified visitor tracking beats modeled assumptions every time when you're presenting to a city council.
- Second, reporting speed. Real-time dashboards let you show impact while the event is still running. Post-event reports that take weeks to compile miss the window when stakeholder interest is highest.
- Third, integration depth. The best sports tourism ROI measurement solutions CVB impact tracking software connects directly to hotel booking systems, ticket sales, and participant surveys. If you're manually pulling data from five different sources to build a report, you're already behind.
- Fourth, cost structure. Per-event fees make sense for occasional hosts. Annual subscriptions work better for sports commissions running multiple events. We looked at both models to understand total cost of ownership.
- Finally, stakeholder reporting features. Executive summaries and certified reports carry more weight than raw spreadsheets. Benchmark comparisons across similar events help frame your numbers in context that matters to decision makers.
Best Overall Sports Tourism ROI Solution: Fastbreak AI
Fastbreak Pulse delivers verified economic impact reporting through first-party attendee data collected directly from participants. Instead of relying on generic mobile signals or consultant-led estimates, Pulse integrates with actual event operations to track visitor origin, hotel bookings, ticket sales, and spending patterns in real time. The key difference is integration depth: because Fastbreak already powers the tournament through Compete (scheduling), Travel (housing), and Ticketing, economic data flows automatically.
Key Features
- First-party survey data combined with geolocation tracking and verified room night attribution
- Automatic data collection through existing tournament operations eliminates manual surveys
- Real-time visibility into visitor spending and economic distribution across the region
- Scales across your entire event calendar without per-event consulting fees
- Integrates with Simpleview, Zartico, and Placer.ai for enhanced regional analysis
Limitations
- Requires adoption of Fastbreak's event management ecosystem to unlock full integration benefits
- First-party data collection depends on participant opt-in through the Swoop app
- Cannot provide economic impact analysis for events not managed through Fastbreak platform
- May require training for CVB staff unfamiliar with real-time dashboard interpretation
- Does not offer standalone consulting services for organizations needing independent third-party certification
Bottom Line
Fastbreak Pulse works best for CVBs and sports commissions managing multiple events annually who need cost-effective, verified impact reporting without paying thousands per study. Organizations already using Fastbreak for tournament operations gain automatic economic data collection, while those assessing new event management platforms can build impact measurement directly into their workflow. Sports commissions seeking grant funding or competing for major event bids will benefit most from the verified attendee data that substantiates economic claims to city councils and stakeholders.
EventConnect Quantism
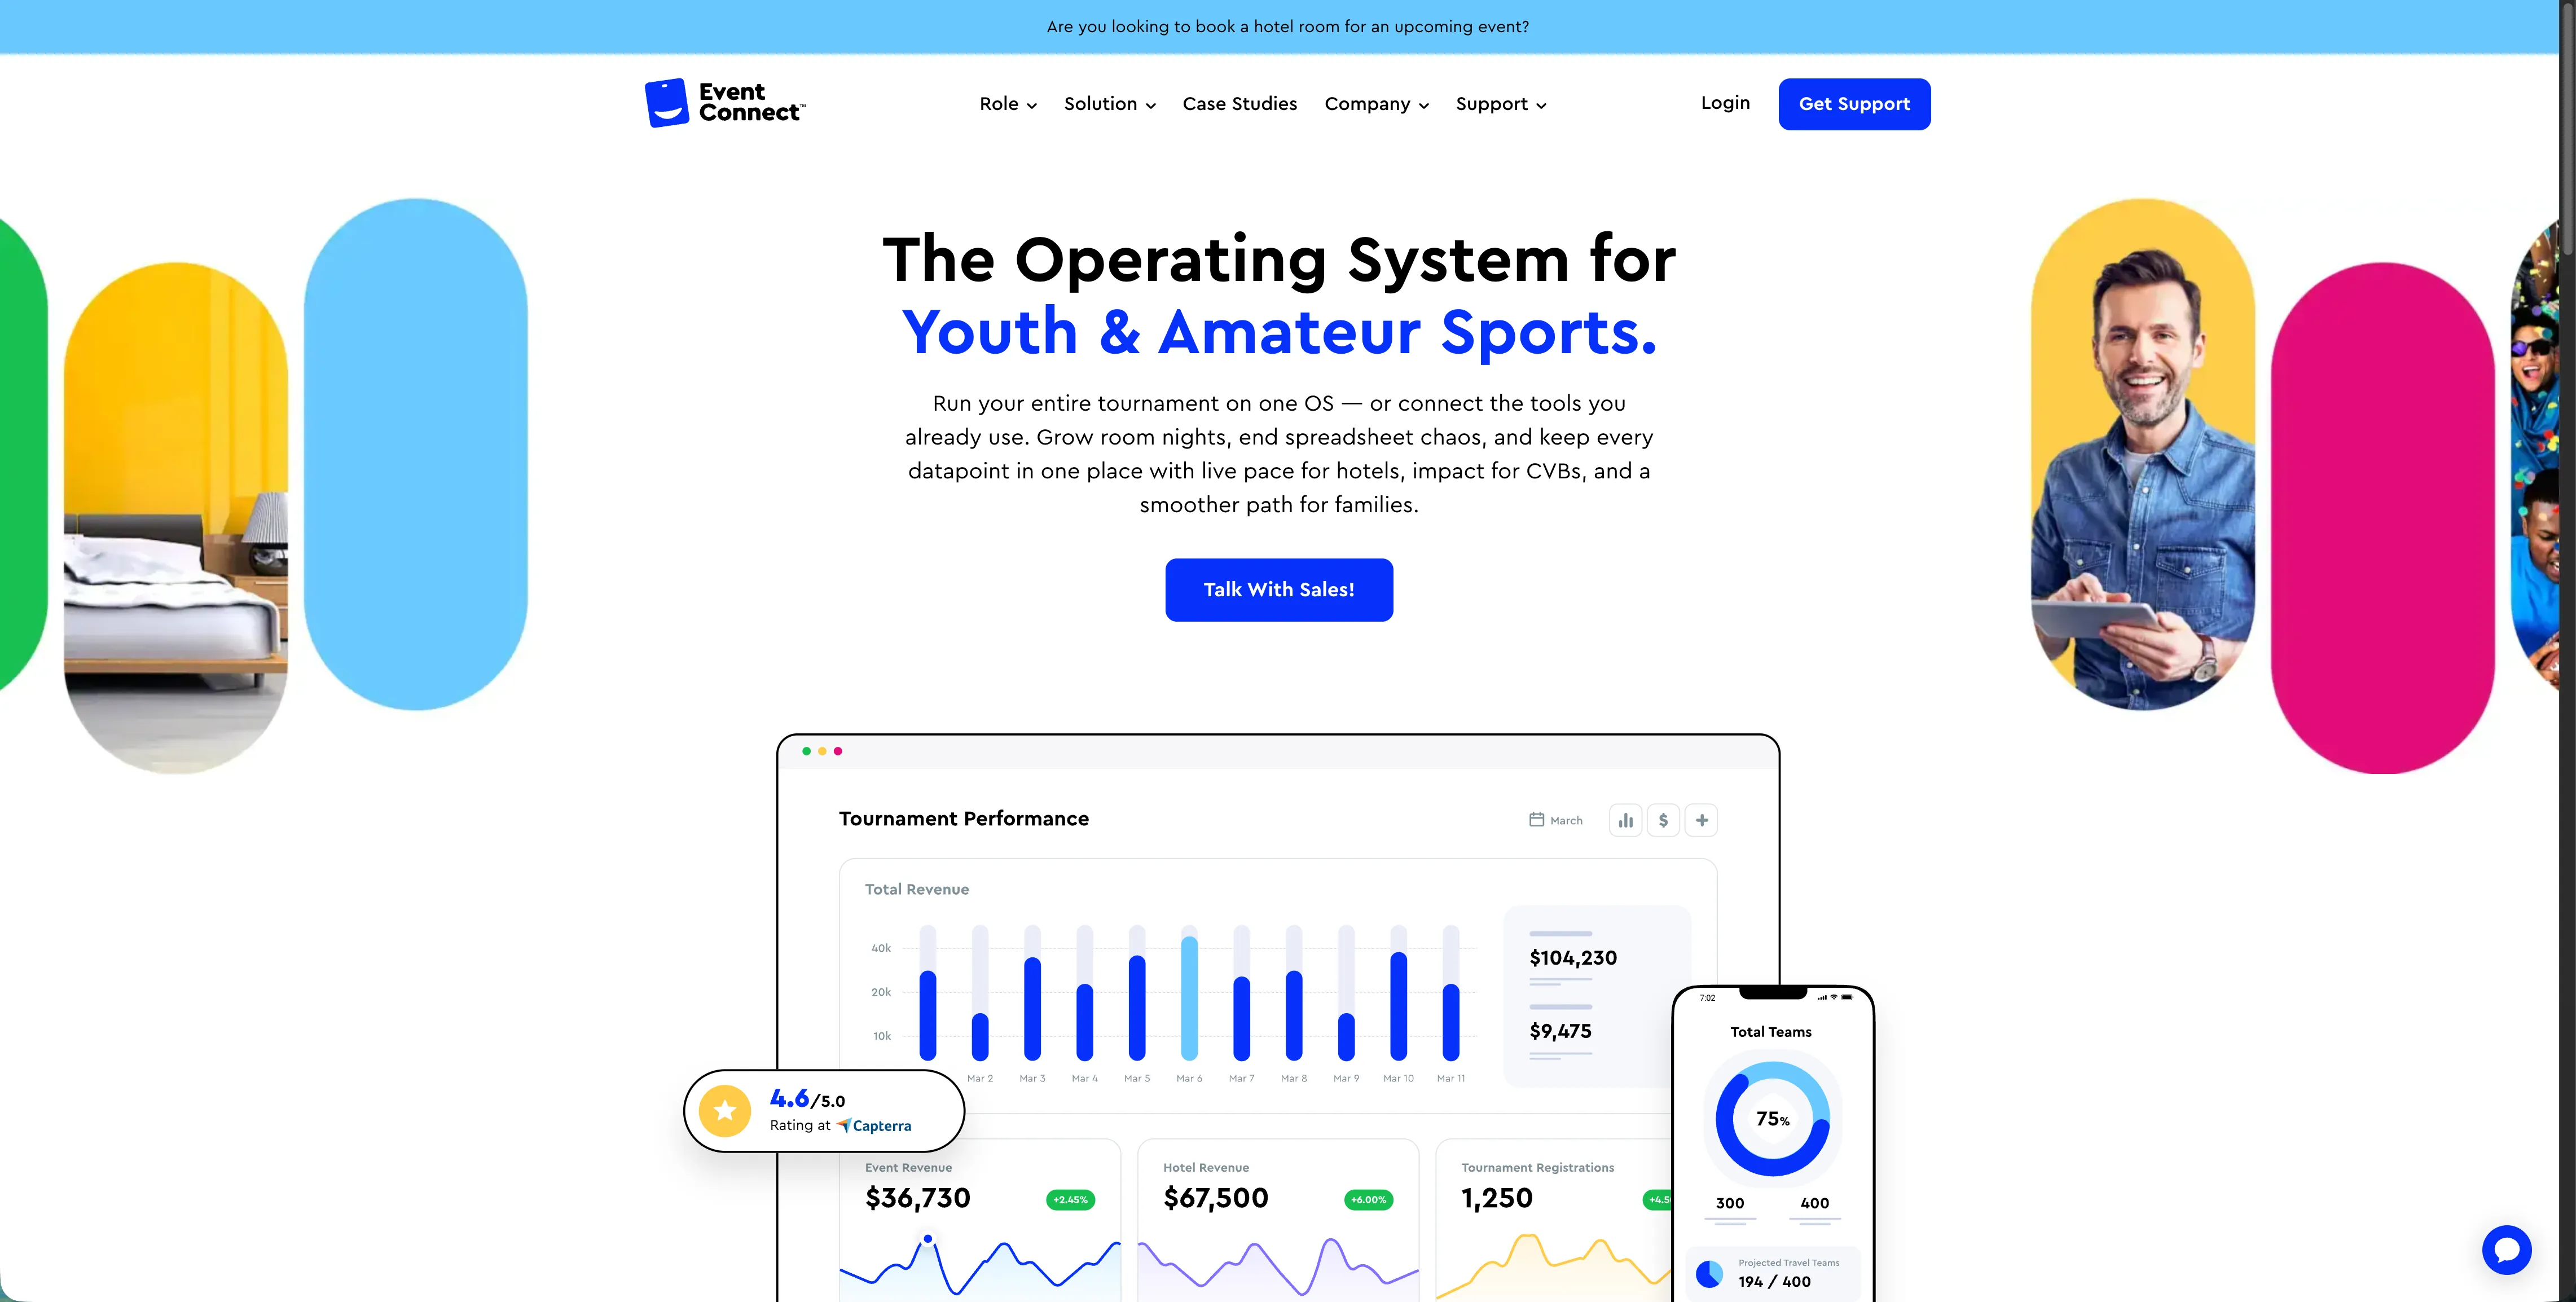
EventConnect launched Quantism in October 2025 as a data intelligence platform designed for sports tourism measurement using mobility data and analytics. The platform focuses on providing standardized economic impact reporting that satisfies third-party verification requirements for bid submissions and grant applications. Quantism aims to deliver certified impact reports with benchmarking capabilities across different sports events and regions.
Key Features
- Provides economic impact dashboards with real-time and post-event analysis capabilities for sports tourism events
- Delivers certified reports formatted for stakeholder and sponsor consumption with third-party verification
- Offers benchmarking tools to compare event performance against similar competitions across different regions and sports categories
- Uses mobility data infrastructure to track visitor patterns and economic activity during sporting events
- Includes customized data queries that allow users to drill into specific metrics when presenting to city officials
Limitations
- Relies on mobility data instead of first-party attendee information, which means working with aggregated location signals instead of verified participant behavior
- Cannot capture granular spending patterns, participant sentiment, or direct engagement metrics that come from integrated event operations
- Operates separately from event registration and housing systems, requiring parallel data collection processes instead of automatic capture
- Does not integrate with scheduling, ticketing, or travel booking platforms that would provide deeper insights
- Pricing structure has not been publicly disclosed, making it difficult to assess total cost of ownership for multi-event tracking
Bottom Line
Quantism works best for event organizers and municipalities that need independent third-party certification for economic impact claims, particularly when submitting bids or proving public funding allocations where external validation carries regulatory or political weight. Sports commissions hosting major one-time events that require academic-level verification will find value in the standardized reporting format. However, organizations running multiple events annually who need participant-level insights and real-time integration would benefit more from platforms that connect directly to registration, housing, and ticketing systems instead of relying solely on mobility tracking data.
Zartico
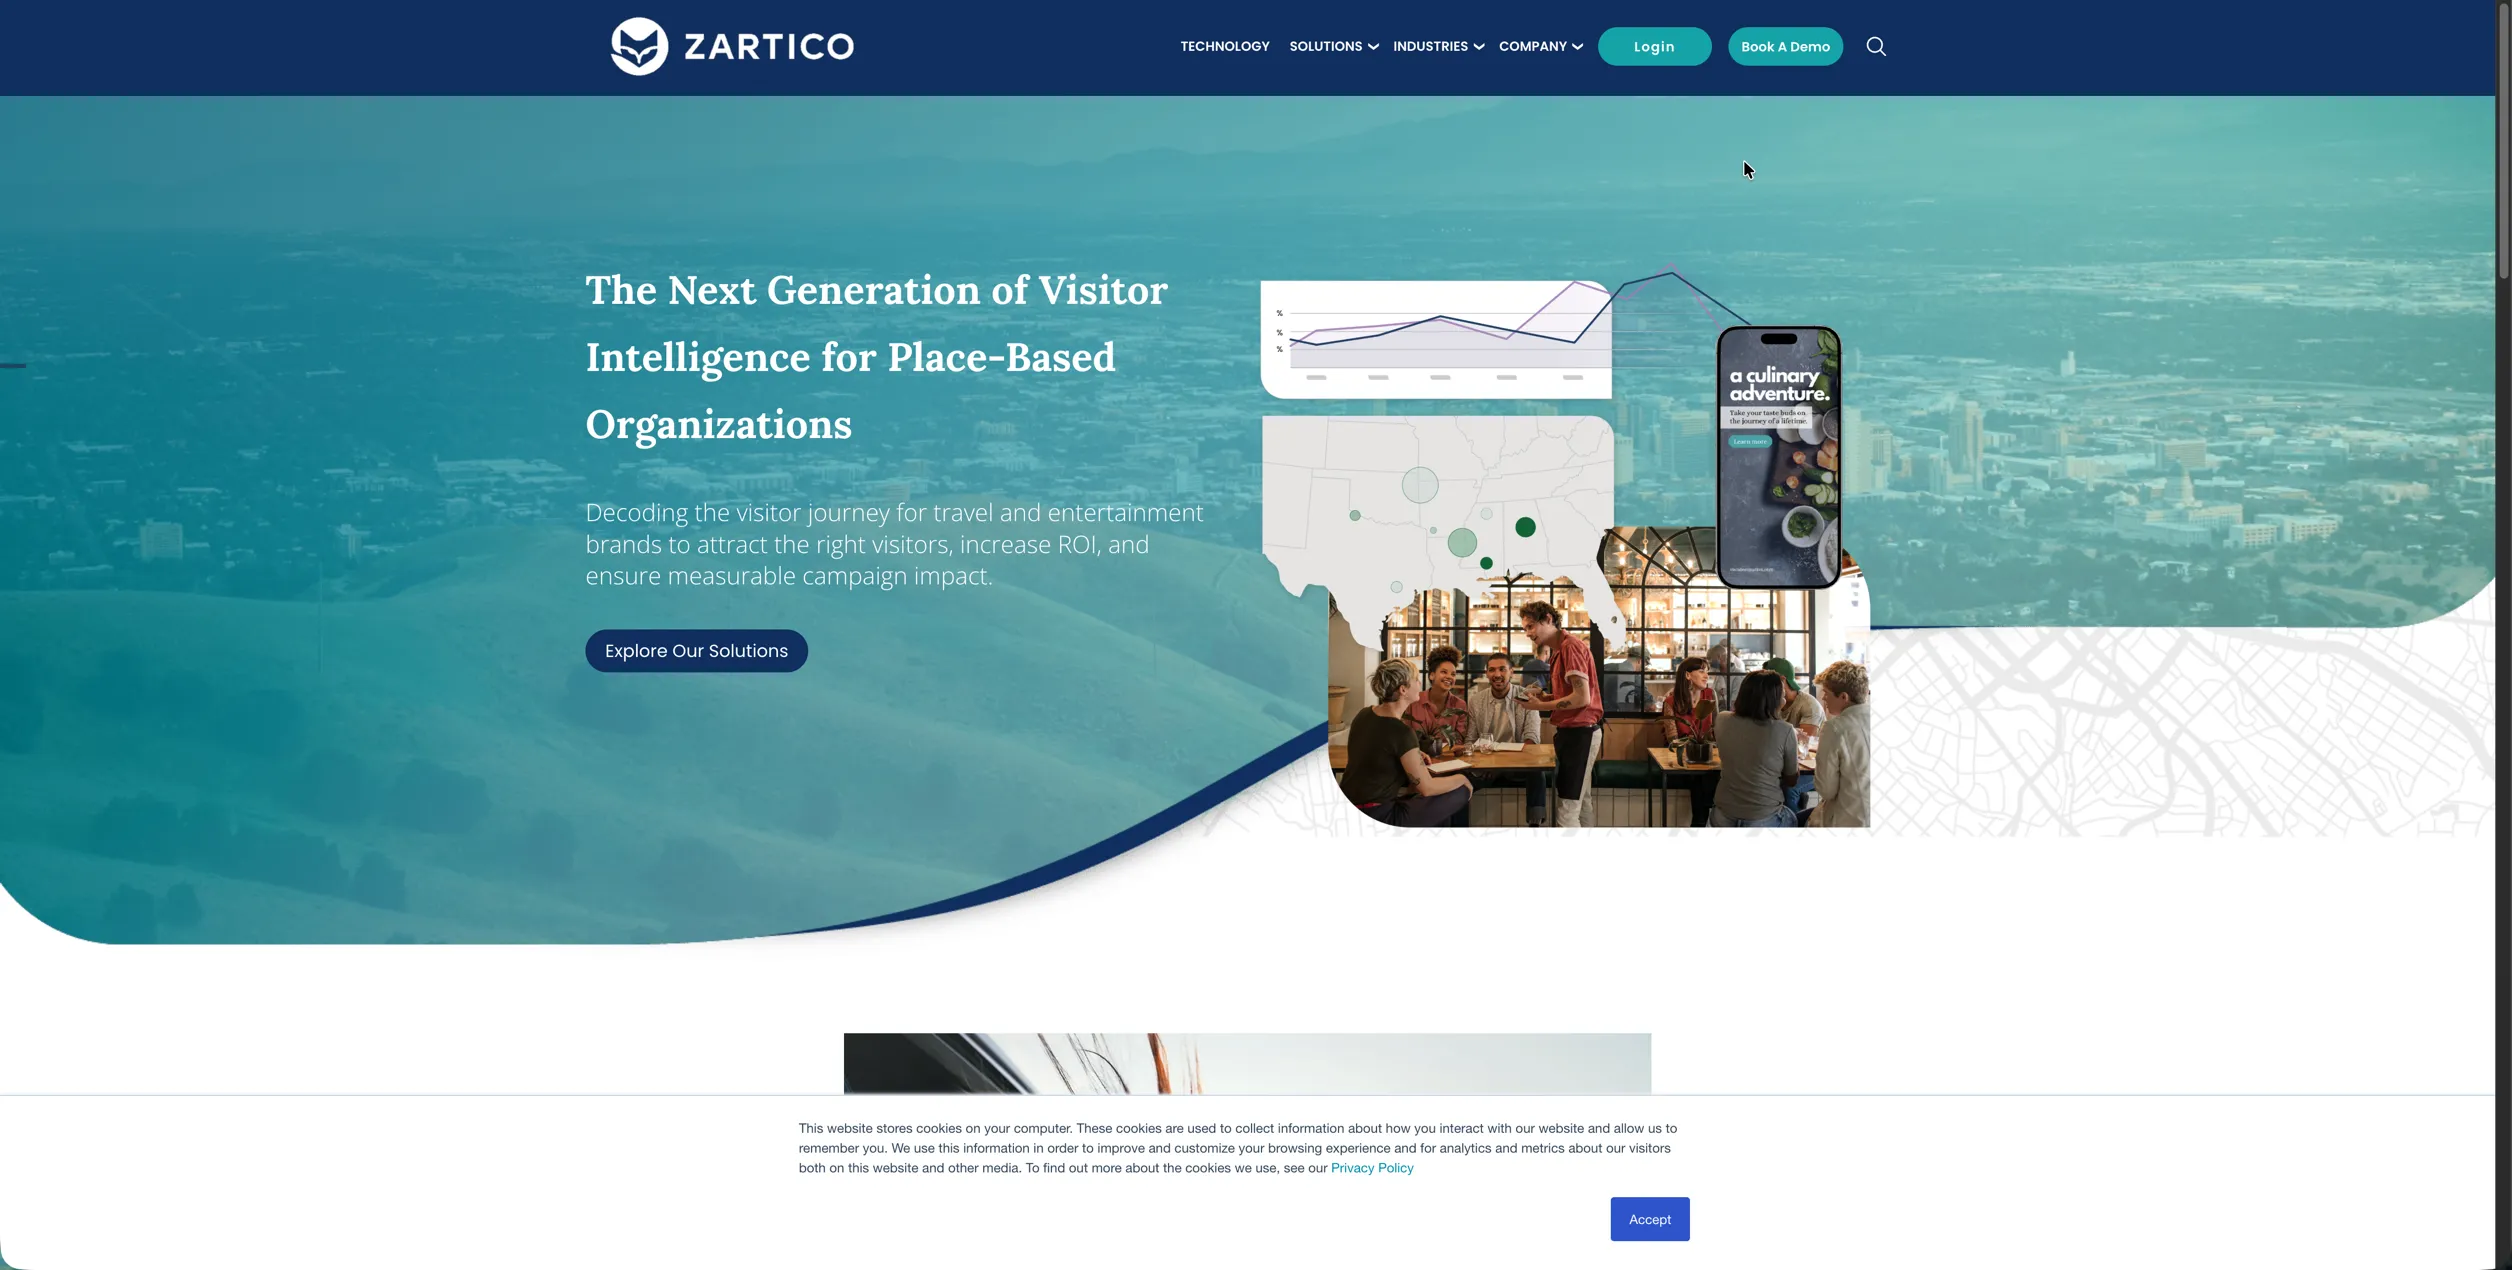
Zartico provides visitor intelligence and destination analytics using integrated data from geolocation tracking, spending patterns, and marketing attribution. The platform focuses on understanding visitor behavior across your entire destination, not individual sporting events. The system combines multiple data sources to help DMOs measure tourism impact and optimize marketing campaigns at the regional level.
Key Features
- Delivers census-level visitor journey tracking that connects digital marketing campaigns to actual arrivals and spending behavior
- Provides always-on data collection that monitors visitor movement, credit card transactions, and campaign interactions across all tourism activity
- Offers marketing performance measurement that links specific campaigns to visitor volume and economic outcomes in real time
- Includes destination-wide analytics that combine hotels, restaurants, attractions, and events into one intelligence layer
- Integrates geolocation signals with spending data to show where visitors go, what they buy, and how long they stay
Limitations
- Built for general tourism measurement instead of sports event operations, missing participant-level insights tied to registration data
- Cannot track team rosters, attendee surveys, or behavior patterns specific to tournament participants and their families
- Does not integrate with scheduling, housing, or ticketing systems that capture data unique to sports events
- Focuses on broad destination trends instead of individual event performance, making it difficult to isolate single tournament impact
- Requires combining with other tools to get complete picture of sports tourism economics beyond general visitor patterns
Bottom Line
Zartico works best for DMOs managing broad destination marketing strategies who need to understand overall visitor trends across multiple tourism sectors and measure how marketing dollars translate into regional economic activity. Convention and visitors bureaus tracking year-round tourism performance across hotels, restaurants, and attractions will find value in the complete destination intelligence. However, sports commissions running multiple tournaments who need participant-specific insights, real-time event operations data, and verified attendee tracking would benefit more from platforms that integrate directly with registration and housing systems instead of relying solely on aggregated geolocation and spending signals.
Traditional Economic Impact Consulting Studies
Economic consulting firms conduct event-specific impact studies using post-event surveys, multiplier models, and Input-Output analysis frameworks. These studies typically involve hiring third-party economists or research firms to analyze visitor spending, employment effects, and tax revenue generation after an event concludes. Consultants use proven methodologies like IMPLAN or RIMS II to calculate direct, indirect, and induced economic impacts through detailed data collection and modeling.
Key Features
- Delivers complete reports using peer-reviewed economic modeling frameworks recognized by academic institutions and government agencies
- Provides independent third-party validation that carries credibility with city councils and grant committees assessing funding requests
- Includes detailed breakdowns of direct spending, indirect effects, and induced impacts across different economic sectors
- Offers customized analysis tailored to specific event characteristics, regional economic conditions, and stakeholder requirements
- Generates certified reports that satisfy audit requirements for public funding accountability and bid submission documentation
Limitations
- Costs range from several thousand to tens of thousands of dollars per event, making frequent analysis prohibitively expensive for most organizations
- Requires weeks or months to complete after the event ends, missing the window when stakeholder interest peaks
- Relies heavily on post-event surveys that suffer from low response rates and recall bias from participants
- Cannot provide real-time insights during the event when adjustments could improve outcomes or inform immediate stakeholder communications
- Becomes impractical for sports commissions managing multiple events annually due to cumulative costs and resource requirements
Bottom Line
Traditional consulting studies work best for major one-time events where budget allows complete analysis and long development timelines are acceptable, particularly when independent academic validation carries a lot of weight with funding authorities. Cities hosting championship tournaments or bid processes requiring detailed economic justification will find value in the rigorous methodology and third-party credibility. However, sports commissions running multiple events annually who need cost-effective solutions, real-time reporting capabilities, and scalable impact measurement across their entire event calendar would benefit more from automated platforms that collect verified data through integrated event operations instead of retrospective consultant-led analysis.
Spreadsheet-Based Manual Tracking Methods
Many CVBs and sports commissions use manual data collection combining hotel reports, venue attendance estimates, and generic economic multipliers in spreadsheet software like Excel or Google Sheets. These methods involve staff manually gathering information from various sources after events conclude and applying standard formulas to calculate estimated economic impact. Organizations typically create custom templates that track basic metrics like room nights, attendance figures, and apply regional spending averages to generate impact projections.
Key Features
- Requires minimal upfront technology investment using existing spreadsheet software already available to most organizations
- Offers complete flexibility to customize data collection fields and calculations based on available information sources
- Allows organizations to maintain full control over methodology, assumptions, and reporting formats without vendor dependencies
- Provides for quick adjustments to formulas and multipliers when stakeholders request different analysis perspectives
- Provides familiar interface that requires no specialized training for staff already comfortable with basic spreadsheet functions
Limitations
- Relies on estimates and assumptions instead of verified data, creating credibility gaps when presenting to sophisticated stakeholders
- Requires hotel partners to manually report room nights, creating delays and incomplete information that undermines accuracy
- Cannot track visitor origin, spending patterns, or economic distribution across the region beyond basic aggregated estimates
- Demands a lot of staff time for data collection and compilation, pulling resources away from strategic event development work
- Produces reports that lack third-party validation or standardized methodology, making them vulnerable to scrutiny during funding reviews
Bottom Line
Manual spreadsheet methods work best for very small organizations with minimal event activity and no budget for dedicated software solutions, particularly when stakeholder reporting requirements remain informal and basic attendance counts satisfy funding justification needs. Volunteer-run sports commissions hosting one or two small tournaments annually may find the approach adequate for internal planning purposes. However, organizations seeking grant funding, competing for major event bids, or managing multiple tournaments who need credible impact data that withstands city council scrutiny would benefit more from automated platforms that collect verified attendee information through integrated event operations instead of relying on manual estimates that fail to prove actual economic value.
Feature Comparison Table of Sports Tourism ROI Measurement Solutions
The table below compares core capabilities across sports tourism ROI measurement approaches. Use it to assess which solution matches your reporting requirements and stakeholder expectations.
Why Fastbreak AI Is the Best Sports Tourism ROI Solution
Fastbreak Pulse gives CVBs and sports commissions something competitors can't deliver: verified economic impact data collected automatically through integrated event operations. You're not paying consultants thousands per study or waiting weeks for retrospective analysis. You're not relying on generic mobile signals that can't distinguish participants from local traffic.
The integration advantage changes everything. When we power the tournament through Compete, Travel, and Ticketing, economic data collection happens automatically. Participant origin, hotel bookings, spending patterns, and satisfaction scores flow into Pulse without requiring your staff to distribute surveys or chase hotel partners for room night reports. You get real-time dashboards during the event and stakeholder-ready reports immediately after. Track your entire event calendar without separate consulting fees for each tournament. Present verified numbers to city councils that substantiate grant funding and strengthen future bid proposals.
Traditional consulting delivers academic rigor but fails on speed and cost. Generic visitor tracking scales but misses participant-level insights. Fastbreak Pulse combines verified accuracy with effectiveness at a price point that makes economic impact measurement accessible regardless of commission size.
Final Thoughts on ROI Measurement for Sports Tourism
Stakeholders stopped accepting generic estimates years ago, but most economic impact reporting tools still rely on backward-looking consultant studies or unverified mobile signals. Fastbreak Pulse integrates directly with your event operations to capture first-party participant data in real time. You get credible reports immediately after each tournament without the cost or delay that makes traditional impact measurement impractical for most commissions.
FAQ
How do I choose the right sports tourism ROI measurement tool for my CVB?
Start with your event volume and budget structure. If you run multiple events annually, look for solutions with subscription pricing and automated data collection. If you only host occasional tournaments, per-event consulting might work. Favor tools that integrate with your existing registration and housing systems to avoid manual data entry.
Which sports tourism analytics platform works best for small sports commissions with limited budgets?
Fastbreak Pulse scales to commission size because it charges based on event volume, not per-study consulting fees. Manual spreadsheet tracking appears cheaper upfront but produces unreliable estimates that fail to make a case for grant funding. The cost of losing a bid or grant approval far exceeds the investment in verified data collection.
What's the difference between mobility data tracking and first-party attendee data?
Mobility data uses aggregated location signals from phones to estimate visitor patterns across a region. First-party attendee data comes directly from registered participants through surveys, registration systems, and verified bookings. First-party data gives you actual spending behavior and participant origin, while mobility tracking provides modeled projections that can't distinguish tournament attendees from local traffic.
Can sports tourism ROI tools help win future event bids and grant applications?
Yes. Verified economic impact reports with certified data strengthen bid proposals by proving your market delivers measurable returns. City councils and grant committees want hard numbers showing visitor spending, hotel occupancy, and tax revenue before committing public funding. Benchmark comparisons against similar events in other markets add context that makes your case more persuasive.
