






Convention and visitors bureaus have relied on surveys and rough estimates for years. A newer approach is starting to replace the guesswork with real data.
When a sports event comes to town, it's easy to focus on the scoreboard. For the city hosting it, the more useful question is different: what did this event actually do for the local economy and the community around it?
Convention and visitors bureaus and local sports commissions have wanted to answer that for years. How many people attended? Where did they stay? How much did they spend? Which local businesses felt it? Traditionally those answers came from manual surveys or economic models applied after the fact, often through outside firms that specialize in that kind of reporting. It worked, but slowly, and with a fair amount of guesswork built in.
What Changes When the Data Is Real
A newer approach combines digital surveys with location data and spending patterns, collected with visitor consent, to build a faster and more detailed picture of what an event actually produced. Instead of extrapolating from a sample of survey responses weeks after the event ends, cities can see attendance, visitor origin and hotel activity closer to real time.
A Real Example: Measuring Impact at a Regional Sports Showcase
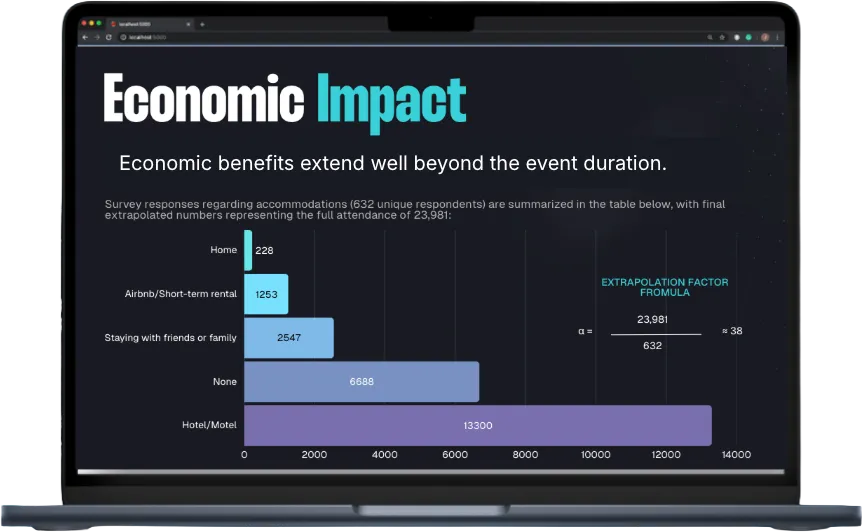
Consider a snapshot from a recent report for a boys volleyball showcase. Using a combination of surveys and anonymized visitor data, the event organizers were able to see:
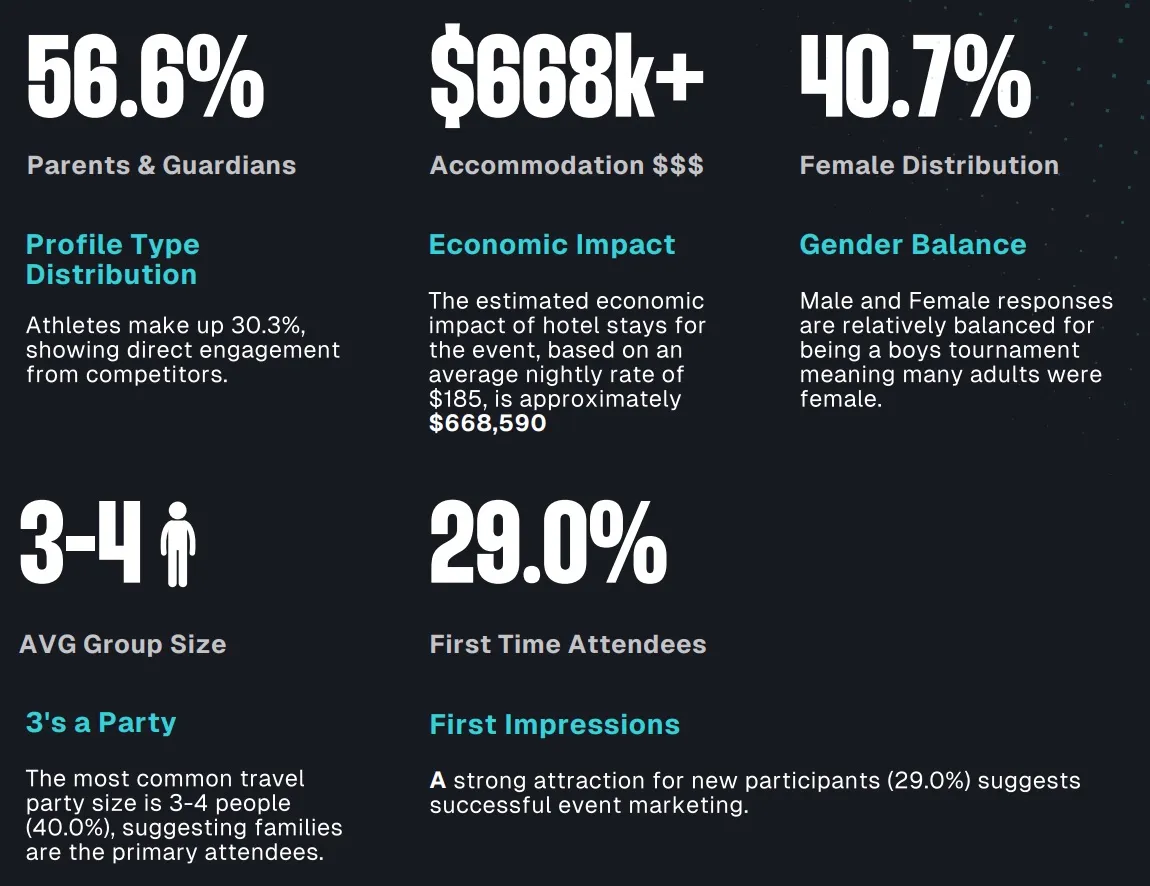
A recent report from a regional boys volleyball showcase is a useful example. By combining survey responses with anonymized visitor data, organizers could see where attendees came from, how long they stayed and what that translated to in local spending, the kind of detail that helps a city understand not just whether an event was worth hosting, but which parts of it actually drove the return.
That level of detail matters beyond a single event. Reliable data lets a city justify its tourism budget with real numbers, build a stronger case for future funding, and figure out which visitor segments and local businesses benefit most. It also gives cities something concrete to bring to sponsors and local business partners, rather than a general sense that the event went well. Altogether, it turns hosting a tournament from a one-off bet into a piece of a longer-term economic development strategy, one a city can actually defend at a budget hearing.
The Case for Moving Off Survey-Based Estimates
The appeal of a data-driven approach comes down to three things: faster results, since insights can surface during or shortly after an event instead of weeks later; better accuracy, since it's based on what visitors actually did rather than what a smaller sample of them reported; and more flexibility, since the same underlying data can be shaped into different reports for a city council, a sponsor or a local business association.
Platforms like Fastbreak Pulse are part of that shift, using anonymized location data and real-time spending signals to capture attendance, origin and hotel-night data with a level of resolution traditional surveys weren't built for. Comparative studies against legacy economic models have shown general alignment on key metrics, with the newer approach delivering it faster and with more transparency into how the numbers were built. The practical difference is that decisions end up based on what visitors actually did, not just what a sample of them said they did after the fact.
The Part That Doesn't Show Up on a Receipt
Economic impact tends to be the headline number, but it isn't the whole story. Hosting tournaments and showcases affects a community in ways that are harder to price but not harder to measure.
Community pride is one example. Post-event sentiment surveys, social media engagement and local media coverage can all pick up on the boost a town feels when it's filled with visiting teams and families for a weekend. Youth engagement is another: events can nudge local kids toward joining a team, volunteering or getting involved through a school partnership, and that shows up in participation numbers if a city bothers to track it. Cultural visibility is a third: how often a city gets mentioned in press coverage, local content and search activity during an event window, even for a regional event that won't move a tourism needle by itself.
None of that fits neatly into a revenue spreadsheet, but it's still a real return on hosting. A city that tracks it ends up with a fuller, more honest picture of what an event was actually worth.
Fastbreak Pulse and the Shift Toward Proof
The bigger shift here isn't really about any one vendor or platform. It's that cities are done treating economic impact as an educated guess. Fastbreak Pulse is one version of that shift already in market, giving CVBs a way to combine attendance data, spending behavior and audience insight into one picture instead of stitching together a survey firm's report months later.
For decades, cities took it on faith that hosting a tournament was worth it. Now they can prove it, and the ones who can will be the ones who keep winning the bids.
FAQs
Q: What is sports event economic impact measurement?
A: It's the process of quantifying what a sporting event contributes to a local economy — attendance, visitor spending, hotel nights, and origin of visitors — so cities and sports commissions can evaluate whether hosting was worthwhile.
Q: How do cities traditionally measure the economic impact of sports tournaments?
A: Cities have historically relied on post-event surveys and economic modeling, often through outside firms, to estimate attendance and spending. This approach is accurate in aggregate but slow, since results typically arrive weeks after an event ends.
Q: What is Fastbreak Pulse?
A: Fastbreak Pulse is a platform that combines anonymized location data and real-time spending signals with visitor surveys to measure attendance, visitor origin, and hotel-night activity during or shortly after a sports event, rather than weeks later.
Q: Is data-driven event measurement more accurate than survey-based estimates?
A: Comparative studies against legacy economic models have shown general alignment on key metrics, with data-driven approaches delivering results faster and with more transparency into how the numbers were calculated.
Q: What non-economic benefits do sports events bring to a host city?
A: Beyond direct spending, events can boost community pride, increase youth engagement in local sports programs, and raise a city's cultural visibility through media coverage and search activity during the event window.
Q: Why does real-time data matter for convention and visitors bureaus?
A: Faster, more granular data lets CVBs justify tourism budgets, build stronger funding cases, identify which visitor segments and businesses benefit most, and present concrete numbers to sponsors and local partners.


