

Imagine watching the Super Bowl not just through your own eyes, but through the collective gaze of millions of American households. Fastbreak AI’s newest technology does exactly that, minute by minute, region by region, as the drama unfolds.
We dug into the data on Super Bowl LX to reveal how real people tuned in, tuned out and responded to every twist and turn. Here’s a first look at how different moments in the game sparked surges or dips in viewership and what truly captivated the nation’s attention.
After the final whistle, we analyzed how fans reacted to the Winter Olympics programming that followed, giving us a unique window into American TV’s biggest night.
What the Super Bowl Looked Like Through Millions of Screens
Fastbreak AI’s next-generation AI-powered viewership behavior platform gives sports leagues and TV networks immediate, high-fidelity insight into how fans actually watch sports. Instead of relying on small, panel-based samples from audience measurement providers, this approach analyzes real viewing behavior across tens of millions of smart TVs, capturing exactly when audiences tune in, how long they stay and what moments drive engagement. By applying advanced analytics to aggregated automatic content recognition (ACR) data, this new platform delivers second-by-second visibility into audience arrival, engagement and drop-off through any time period.
This level of precision allows leagues to evaluate broadcasts in ways legacy panel-based measurement systems never could. It enables sports leagues to understand their viewers in ways previously not possible with far greater scale, speed and accuracy than existing platforms. In addition, with predictive TV viewership based on historical analysis over past seasons, the technology can directly inform scheduling decisions, ideal game windows, regional matchups and allow for truly optimized broadcast strategies to help leagues maximize viewership and advertising revenue.
What Happened in Santa Clara and Why It Mattered for Viewership
Seattle won with a formula that often scares casual fans on paper: pressure, turnovers and field goals. Kenneth Walker III carried the offense (135 rushing yards) and was named Super Bowl LX MVP. Seattle’s defense sacked Patriots quarterback Drake Maye six times, and the game included a late interception return touchdown that put the result out of reach. Jason Myers set a Super Bowl record with five made field goals, an all-time signal of sustained drives that ended short of the end zone.
For viewership, that mix is far more compelling than it sounds. A defensive game creates tension. It turns every possession into a leverage moment. And when a game stays within striking distance for most of the night, the audience behaves differently: fewer people leave early because they're waiting for the swing.
A Closer Look at How America Watched Super Bowl LX
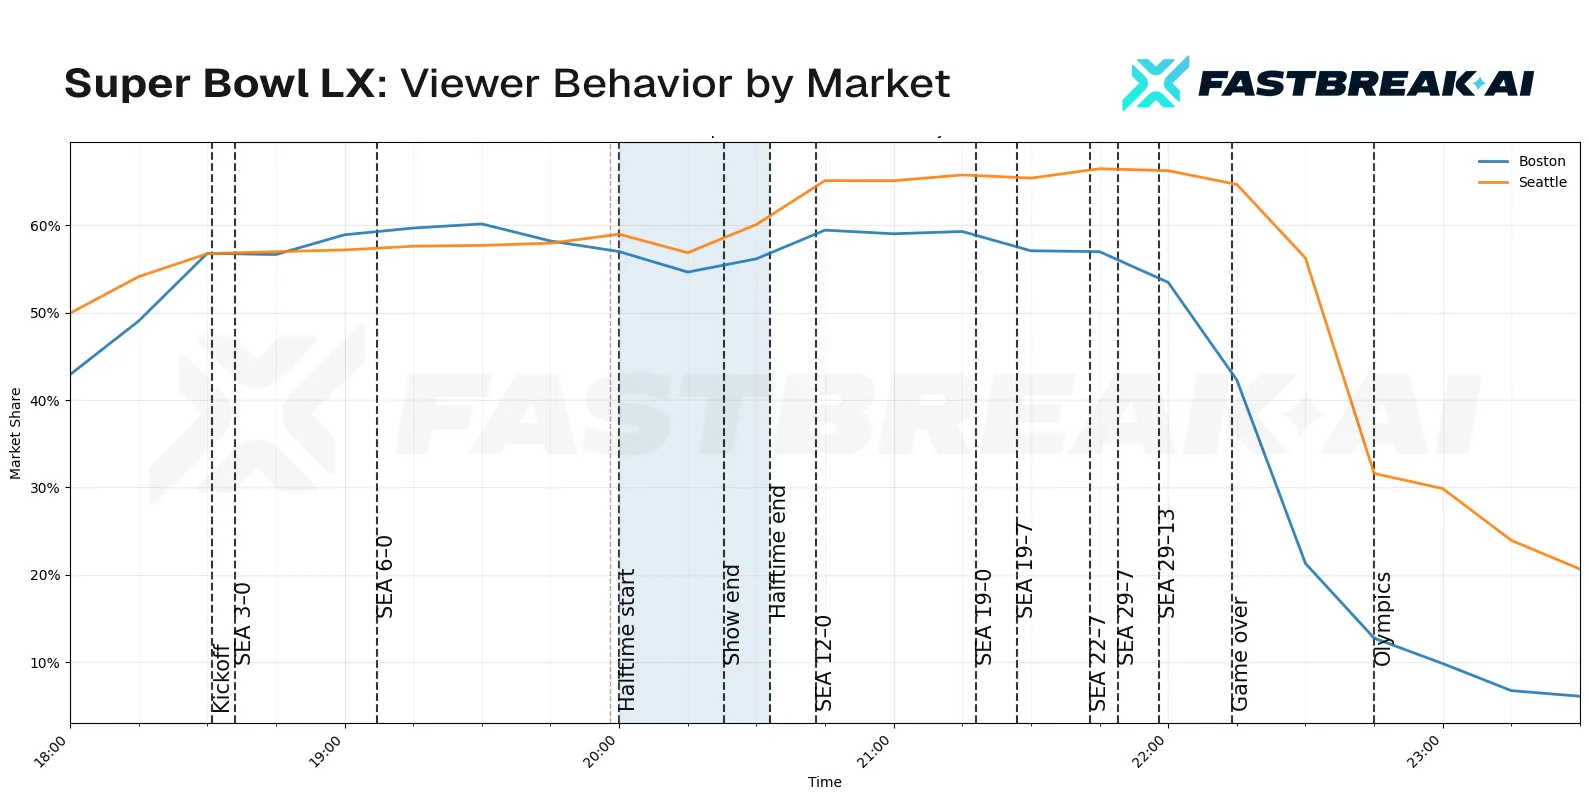
This viewership curve highlights this capability by comparing the Seattle audience with the greater Boston market, charting minute-by-minute viewership. Unlike panel-based next-day summaries, this granular view reveals exactly when viewers tuned in, why they stayed and what ultimately made them leave.
The orange line is the Seattle audience. The blue line is Boston, shown on its own scale on the right axis. Vertical markers call out key moments, including kickoff, halftime and notable in-game events.
The most important insight isn't a single peak number. It’s the pronounced shape of the curve.
- People arrived late and then committed.
The national curve trends down during the late pregame window, then snaps upward at kickoff and accelerates quickly into a high plateau. That pattern is classic “event viewing” behavior: people don't necessarily watch every pregame segment, but they show up for the stakes. - The audience didn’t punish low-scoring early.
From the first major climb through the first half, the national line stays strong and continues to rise. That matters because many low-scoring games bleed viewers. Super Bowl LX did the opposite. The curve implies the broadcast was delivering enough tension, story and spectacle to keep attention even without constant touchdowns. - Halftime acted like a second kickoff.
Immediately after halftime, the Seattle curve reaches its highest sustained levels of the night. That's exactly what you want if you're measuring audience stickiness. That meant people didn't treat halftime as a break from viewing. They treated it as an anchor. - Boston’s viewership was reactive to game context.
The Boston market curve generally follows the overall trend but shows sharper shifts tied to changes in game momentum. It rises strongly as the game begins, holds through competitive windows, and declines more steeply once the outcome becomes certain, reflecting emotional investment tied to New England’s prospects.
The Most Surprising Part Of Super Bowl LX Viewership:
The Third Quarter Plateau
Most big games peak early, then gradually lose viewers. This curve shows something more valuable: a long, high plateau until Q4. That signals two things:
- The game still felt alive. Even if the scoring pace was slow, the outcome wasn't settled. The audience stayed because the margin still allowed for a believable swing.
- Every play felt like it mattered. A defensive Super Bowl creates constant “next play” moments: sacks, third downs, field position, turnover threats. Seattle’s pass rush and New England’s struggle to sustain drives created that steady tension.
This is where a defensive Super Bowl can outperform a sloppy shootout. A shootout can feel decided early if one team jumps ahead by two scores and keeps answering. A defensive game can sustain the illusion of possibility longer because a single turnover can change everything.
Why The Late Drop Happened, and Why That’s a Good Sign
The curve’s most pronounced decline comes late. That isn't a “boring game” signal. It's an “increasing certainty” signal.
Once the audience senses that the probability of a comeback is collapsing, neutral viewers start to peel away. In this game, Seattle’s late defensive touchdown and the overall control implied by record-setting field goal production made the result feel stable.
Super Bowl LX viewership suggests the Super Bowl doesn't require fireworks to hold attention. It requires believable leverage. The audience stays as long as they believe the next sequence can change the story.
A Living Heat Map of Attention
This animated market map turns the viewership curve into motion. It makes one thing clear: engagement isn’t viewership. Viewing behavior is geographic, emotional and moment-driven.
.gif)
Instead of a single national line, you can visualize county-by-county engagement shifting throughout Super Bowl LX. At kickoff, the country darkens almost in unison, a clear visual of appointment viewing. The surge is immediate and nationwide.
Through the first half, engagement remains broadly strong despite limited scoring. Defensive tension keeps large portions of the country lit. Halftime becomes the visual inflection point.
When Bad Bunny takes the stage, intensity strengthens across major metros and Hispanic markets. Engagement it isn’t regional, it’s national - the country brightens, not dims.
The third quarter plateau is even more telling. Colors hold steady across most regions, reflecting sustained tension and a still-believable outcome. Only after Seattle’s late defensive touchdown does the map gradually soften, with neutral markets fading first.
As the broadcast transitions to the Winter Olympics, the animation shows redistribution rather than collapse.
Seattle vs. Boston: What The Divergence Really Tells You
The chart is a clean demonstration of two different audiences watching the same game:
- National viewers are watching an event. They're and responding to stakes, spectacle and story. Their curve is smoother and more anchored around halftime and the post-halftime plateau.
- Local viewers are watching their team. Boston’s curve is more reactive, with sharper rises and sharper late declines once hope fades, while Seattle stays strong until the confetti and trophy.
This split matters for how leagues price ad inventory and structure their broadcast deals. National advertisers pay for halftime adjacencies and fourth-quarter drama; they’re looking for the moments that can keep 100 million viewers locked in. Local market advertisers pay for emotional investment, which means they value competitive games where the region’s team has a shot.
That's why a national broadcast optimizes for spectacle and pacing, while regional windows prioritize tight matchups and playoff implications. Different audiences, different engagement strategies.
The Counterintuitive Takeaway: Defense Can Be A Viewership Advantage
A low-scoring Super Bowl can be a trap. If it feels stagnant, viewers drift. But a low-scoring Super Bowl can also be a magnet when it creates sustained tension and keeps the “next moment” meaningful.
Super Bowl LX had the ingredients that make defense compelling to millions:
- Clear identity: Seattle’s defense dictated terms.
- Visible consequences: sacks, turnovers, and field position swings were obvious even to casual fans.
- A halftime anchor: Bad Bunny delivered a culturally significant show that kept the national audience engaged through the midpoint.
- A long competitive window: the curve shows the audience staying high well beyond halftime before the late certainty drop.
What this tells us: the Super Bowl’s modern viewership ceiling is less about points and more about architecture. If the broadcast delivers a second-half plateau, it's winning.
What Super Bowl LX Viewership Implies For Future Super Bowls
This curve should change how teams, leagues and broadcasters talk about “the product.”
- Halftime is a strategic asset, not a tradition.
It's the moment that can lift the entire second half. Maybe that’s a tradition worth starting. - Retention is created by uncertainty, not scoring.
The goal is to keep the outcome plausible for as long as possible. Defensive football can do that. - Local markets amplify emotion, national audiences amplify spectacle.
The best Super Bowls satisfy both at once.
Super Bowl LX viewership, as shown in this proprietary analysis from Fastbreak AI, reinforces a clear takeaway: the biggest night in sports still functions as true appointment television. Even in a low-scoring, defense-driven game, viewers stayed engaged deep into the fourth quarter. They didn't need constant scoring to stay. They needed tension, stakes and moments that mattered.
What’s most interesting is what this level of visibility now makes possible. When viewership can be understood minute by minute and market by market, the conversation shifts from what people think happened to what actually did. That opens the door to new ways of understanding audience behavior, broadcast value and how the structure of a game or a season schedule shapes attention.
